18 May 2022


Interest rate implications of an economic downturn
Independent economist Tony Alexander shares his monthly view:
Come May 25 the Reserve Bank are likely to increase the official cash rate by another 0.5% to 2.0% as they take away the pandemic stimulus and try to actively restrain growth in the economy. Those last five words are the most important in that sentence because we can already see growth being restrained to such an extent that talk has arisen of a potential recession.
The talk has been driven by newly surging energy prices, cost of living expenses, and supply chain disruptions caused by Russia’s invasion of Ukraine and China’s out of date strategy for managing covid. If a recession is already a 50:50 call, then we start to enter the territory of our central bank causing instability in the economy should they impose extra interest rate restraint. That is something their policy agreement with the government says they should avoid.
With consumer spending already in retreat, house prices falling at a firm clip near 2% a month, and businesses expressing deep pessimism, the chances of one-off cost hikes feeding through into wage claims and producing a wage-price spiral are quite low.
This doesn’t mean interest rates won’t go higher. But it does suggest that later this year talk will focus more on weakening in the economy and timing for when interest rates start falling, not going higher.
Therefore, as written here last month, I remain of the view that coming mortgage rate rises will be less than many are currently picking. Perhaps just 0.5% further upside remains for fixed rates of two years and beyond, but another 1% or so could still be left for the one-year rate.
For additional information on the economy, housing market, and interest rates, you can subscribe to Tony’s free weekly Tony’s View publication at www.tonyalexander.nz
Now from Isbister Partners
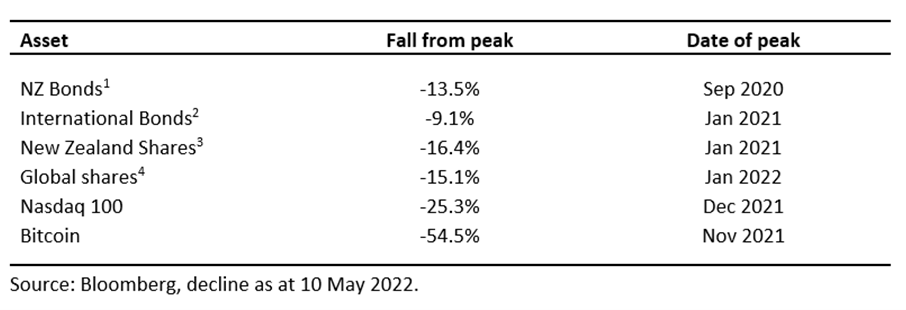
Inflation, supply chain issues and war are causing a lot of uncertainty with financial markets, and they are well off their peaks as illustrated by the table below.
The US treasury yield curve has also inverted recently. This has been followed by media talk that a recession is coming. More on the yield curve later.
As a result, we are hearing common questions being asked of us. So, we’ve decided to have a go at answering some of those for you.
My mortgage interest rate is coming up for renewal, how long should I fix for?
This depends on your personal situation. However, as Tony has indicated above, because the economy is slowing and the US yield curve has inverted, we may see interest rates in the short term keep rising. However, a yield curve represents where the markets see the cost of money going in the future. Typically, a rising yield curve, moving up from left to right, indicates rising interest rates. An inverted yield curve indicates we may see short term rises and then interest rates decreasing. Based on this, fixing your interest rates over the short term could be a good option. Where the markets will really test people is when short term rates creep higher than longer term rates.
Another option: If you have surplus cash sitting around for an emergency or a rainy day, talk to your adviser about making the most of those funds. When your fixed rate comes up for review is a good opportunity to look at the structure of your home loan. We may be able to advise a structure that still allows you access to those funds but reduces your interest cost while you are not using it.
I’m invested in a conservative or defensive Kiwisaver/investment portfolio, why am I seeing such a drop?
A defensive or conservative investment portfolio consists mainly of bonds or fixed interest investments. This is a debt held by a company or government, just like the bank has debt to you. They are similar to term deposits in that you are paid a set interest rate for the term of your bond. The difference is a bond can be bought and sold on an exchange, so it must be valued. Currently many bold holders have bonds on lower interest rates than new participants can get now. So, if you were to sell you would have to discount the value of your bond until it became comparable. Something that is key to holding a bond, is that if held to maturity, you still get your principal amount back (as long as there are no credit defaults), just like a term deposit. Afterall, a bond is a debt that needs to be repaid.
Should we be worried about an inverted yield curve?
According to US Federal Reserve research, an inverted yield curve has preceded all nine US recessions between 1955 and 2019, with a lag time ranging from six months to two years. Does this mean we can expect an imminent market decline in share prices?
Investors who interpreted the inversion as a sign of an imminent market decline and pulled out of stocks could have missed out on subsequent equity market gains. And if those same investors had bought back into stocks when the yield curve’s slope became positive, they would have been exposed to the market downturn that followed.
Dimensional fund advisers monitored 14 cases of inversion across 5 selected developed countries. In 10 out of the 14 cases, equity investors had positive returns after 36 months. This is similar to the historical frequency of positive returns over any three-year span, regardless of the shape of the yield curve. These results show that it is difficult to predict the timing and direction of equity market moves following a yield curve inversion.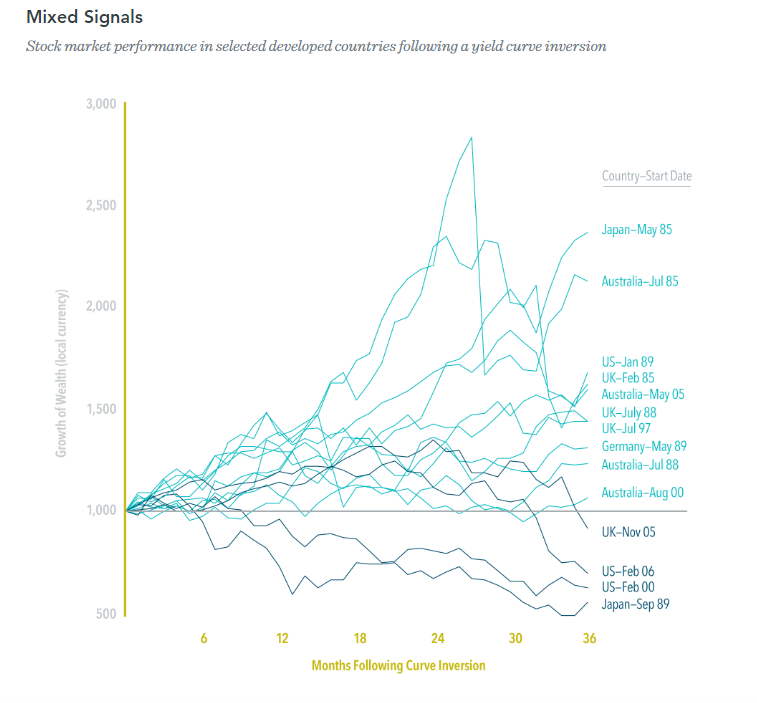
Though the data set is limited, an analysis of yield curve inversions in five major developed countries shows that an inversion may not be a reliable indicator of stock market downturns. So, what can investors do if they are concerned about potential equity weakness? Develop and commit to a long-term plan that is in line with their risk tolerance, look past short-term noise, and focus on investing in a systematic way that will help meet long-term goals.
Thanks to Select Wealth Management and Dimensional Fund Advisers for the charts and research data.
1 Bloomberg NZ Bond 0+ Composite Index
2 Bloomberg Global Aggregate Bond Index (NZD Hedged)
3 S&P NZX 50 Gross Index (Including imputation credits)
4 MSCI All Country World Index (in local currencies)
5 The data shown is the Mixed signals graphic showed a 71% chance of (10of 14) of a three year positive return following a yield curve inversion. To compare, Dimensional measure returns three years following every month-end between January 1985 and December 2014 in each of the five markets based on local currency MSCI indices. The average chance of a three year positive return in those five markets was 77%
Disclaimer: This newsletter is meant to be informative and engaging, hopefully not a cure for insomnia. Please don’t take this as personalised financial advice. Discuss your situation with an Advisor. This is where I need to say past returns are no guarantee of future returns.
 Property Investment is Dead. Long Live Property Investment.
 AI Boom or Bubble
 Mortgage Strategy VS Interest Rate
© 2021 AndCo Mortgages Limited. All right reserved.